PrismWPFSample(7)OxyPlot
Prismを使用したWPFアプリケーション開発で役に立つと思われる項目を一つのアプリケーションにまとめたものを作りました。今回は、OxyPlotについて書いています。
動作環境:Win10, Visual Studio Community 2017, Prism V7.1.0.431, .NET4.5.2, Prism Template Pack, TraceListeners, WPFLocalizeExtension, OxyPlot
アプリの外観はこんな感じです。
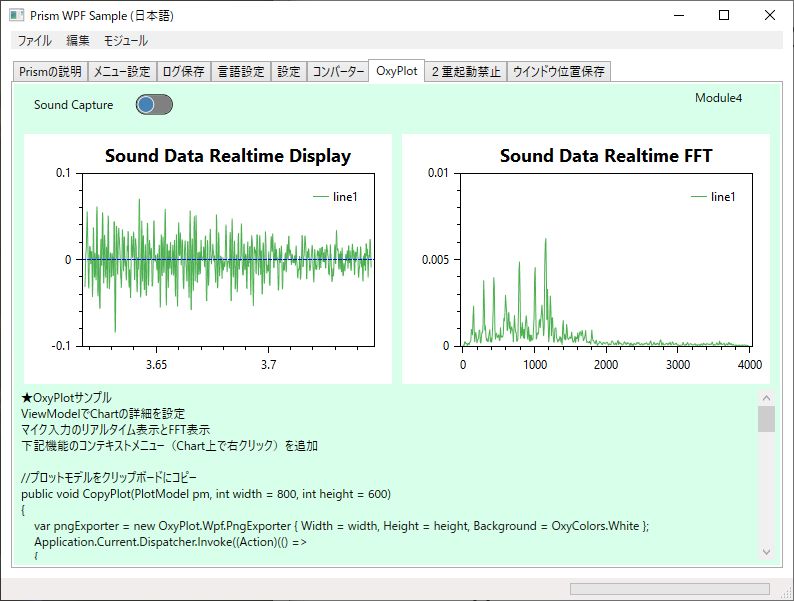
OxyPlot の使い方については以前書いてますので、このサンプルの内容を中心に解説します。
feynman.hatenablog.com
サンプルの動作
OxyPlot のサンプルは Module4 になります。
PCのマイク入力から音声を取り込んで左側の Chart に波形表示、右側の Chart にFFT波形を表示します。
ですので、PCにマイクを差したうえで動作させてください。
あと、 Chart 上で右clickした時に ContextMenu を表示するようにしてあります。
ContextMenu としては、
- 自動リサイズ:データ全体が表示されるようにフィッティング
- 保存:Chartを画像としてファイル保存
- コピー:Chartをクリップボードにコピー
の3つとなります。
OxyPlot の Chart は標準で、以下の機能が組み込まれています。
- マウスホイールでの拡大縮小
- Chart上、左クリックでポイント座標の表示
- 右ドラッグで表示位置の移動
拡大縮小は、X軸上でX軸の拡大縮小 Y軸上でY軸の拡大縮小 Chart内で全体の拡大縮小が可能です。
しかしながら 一度拡大縮小を行ってしまうと、データが新しくなった時もデータに合わせた表示範囲の変更をしなくなってしまうので、それを標準状態に戻すために自動リサイズという ContextMenu を追加しています。
ContextMenu用デリゲートコマンドの追加
Chart を2つ表示して、どちらにも同じ ContextMenu を表示したいので、パラメータ付きのデリゲートコマンドを使用します。
Prism Template Pack で導入されているスニペットから generic タイプを選択して記述します。

private DelegateCommand<PlotModel> commandResizePlot;
/// <summary>
/// 指定されたプロットモデルの表示範囲をリセット
/// Plot1 or Plot2
/// </summary>
public DelegateCommand<PlotModel> CommandResizePlot =>
    commandResizePlot ?? (commandResizePlot =
   new DelegateCommand<PlotModel>(ExecuteCommandResizePlot));
void ExecuteCommandResizePlot(PlotModel parameter)
{
    AutoResizePlot(parameter);
}

public void AutoResizePlot(PlotModel pm)
{
    pm.ResetAllAxes();
    pm.InvalidatePlot(true);
}
View からパラメータとして対応する PlotModel を受け取って、それに対して処理を行うという流れになります。
Chart の保存とコピーの処理も同じようにして下記になります。(デリゲートコマンドは省略)
public void SavePlot(PlotModel pm, string filename = "",
             int width = 800, int height = 600)
{
    if ( filename == "")
    {
        var dlg = new SaveFileDialog
        {
            Filter = ".png files|*.png|.pdf files|*.pdf",
            DefaultExt = ".png"
        };
        if (dlg.ShowDialog().Value) filename = dlg.FileName;
    }
    if (filename != "")
    {
        var ext = Path.GetExtension(filename).ToLower();
        switch (ext)
        {
            case ".png":
                using (var s = File.Create(filename))
                {
                    Application.Current.Dispatcher.Invoke((Action)(() =>
                    {
                        OxyPlot.Wpf.PngExporter.Export(
           pm, s, width, height, OxyColors.White);
                    }));
                }
                break;
            case ".pdf":
                using (var s = File.Create(filename))
                {
                    Application.Current.Dispatcher.Invoke((Action)(() =>
                    {
                        OxyPlot.PdfExporter.Export(pm, s, width, height);
                    }));
                }
                    break;
            default:
                break;
        }
    }
}
public void CopyPlot(PlotModel pm, int width = 800, int height = 600)
{
var pngExporter = new OxyPlot.Wpf.PngExporter
{ Width = width, Height = height, Background = OxyColors.White };
Application.Current.Dispatcher.Invoke((Action)(() =>
{
var bitmap = pngExporter.ExportToBitmap(pm);
Clipboard.SetImage(bitmap);
}));
}
ContextMenu の追加方法
PlotView に ContextMenu を追加するには次のようにします。
PlotView を選択
Property の ContextMenu の新規作成を押して ContextMenu を作成します。
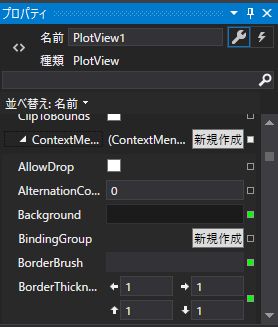
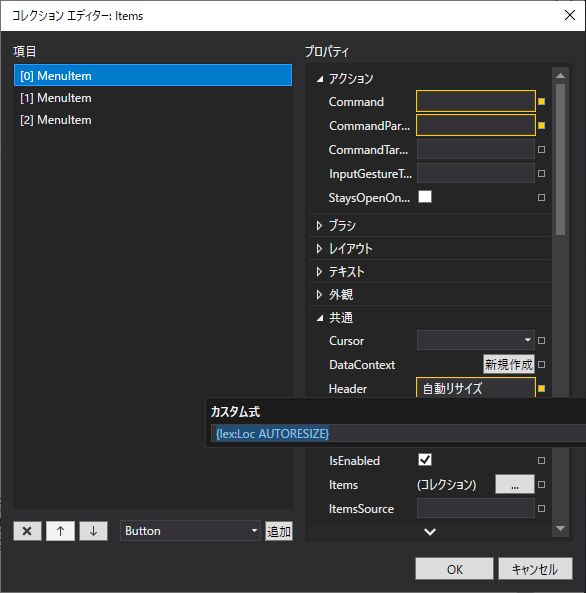
追加された ContextMenu にある Items のボタンを押します。
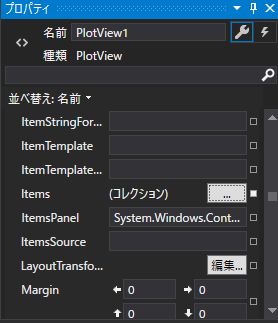
開いたコレクションエディターのダイアログで MenuItem を3つ追加します。
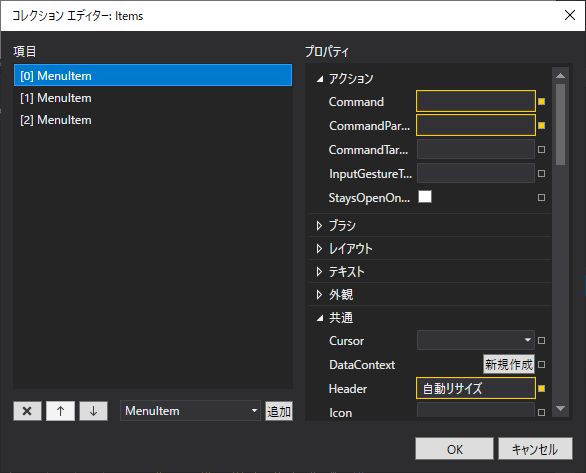
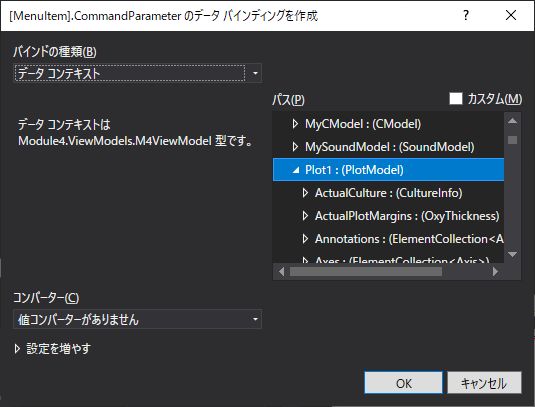
それぞれの MenuItem で追加するのは Command と CommandParameter と Header になります。
Command はViewModel のデリゲートコマンドにバインドします。
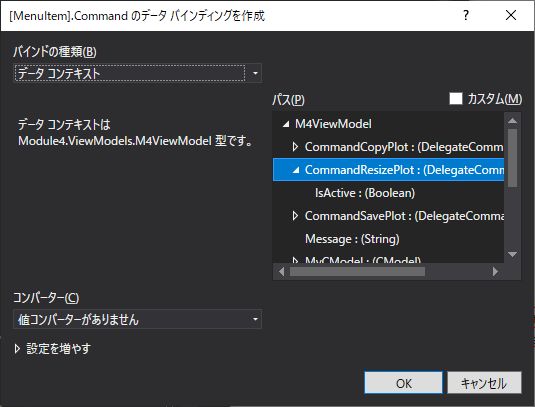
CommandParameter は、操作する ViewModel この場合には Plot1(選択した PlotView とバインドする ViewModel)にバインドします。
Header は ContextMenu に表示される文字となるので、多言語化を考慮して次のようにしておくと、言語切り替えが可能となります。
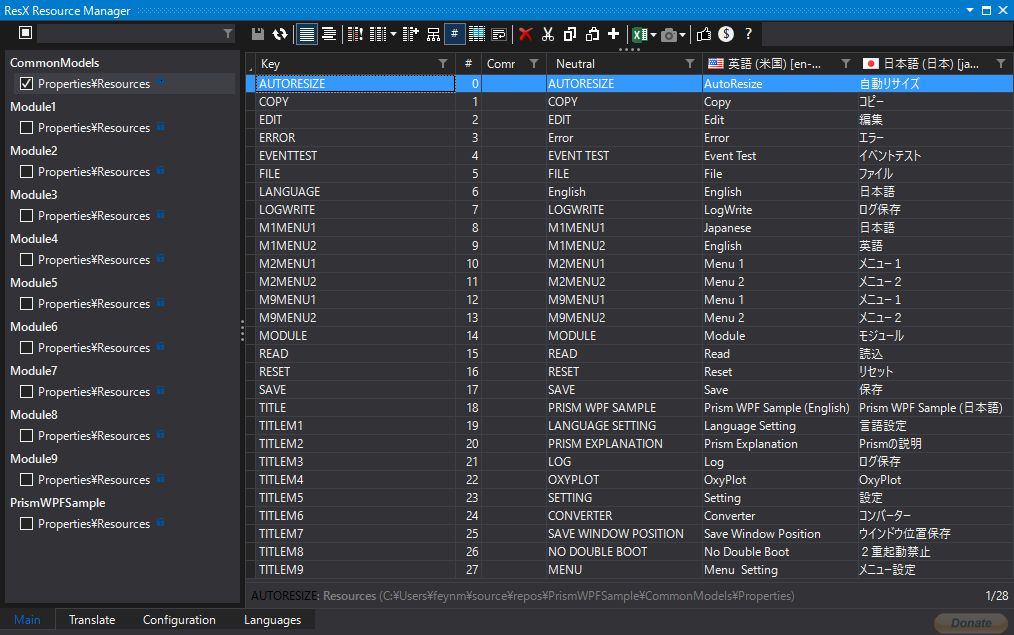
表示される文言はResX Manager で CommonModels のResources に書いておきます。
作成されるXAMLは次の様なものになります。
<oxy:PlotView x:Name="PlotView1" Model="{Binding Plot1}" Margin="0,0,5,0">
       <oxy:PlotView.ContextMenu>
            <ContextMenu>
                 <MenuItem Header="{lex:Loc AUTORESIZE}"
                       Command="{Binding CommandResizePlot, Mode=OneWay}"
                       CommandParameter="{Binding Plot1}"/>
                  <MenuItem Header="{lex:Loc SAVE}"
                       Command="{Binding CommandSavePlot, Mode=OneWay}"
                       CommandParameter="{Binding Plot1}"/>
                 <MenuItem Header="{lex:Loc COPY}"
                       Command="{Binding CommandCopyPlot, Mode=OneWay}"
                       CommandParameter="{Binding Plot1}"/>
          </ContextMenu>
      </oxy:PlotView.ContextMenu>
</oxy:PlotView>
音声キャプチャ
音声キャプチャ用のライブラリーとしては NAudio を使用しています。
github.com
//デバイスの抽出
for (int i = 0; i < WaveIn.DeviceCount; i++)
{
    var deviceInfo = WaveIn.GetCapabilities(i);
    commondata.StatusString = String.Format("Device {0}: {1}, {2} channels",
        i, deviceInfo.ProductName, deviceInfo.Channels);
}
//デバイス0のサンプリングをスタート
waveIn = new WaveIn()
{
DeviceNumber = 0, // Default
};
waveIn.DataAvailable += WaveIn_DataAvailable;
waveIn.WaveFormat = new WaveFormat(sampleRate: 8000, channels: 1);
waveIn.StartRecording();private void WaveIn_DataAvailable(object sender, WaveInEventArgs e)
{
// 32bitで最大値1.0fにする
for (int index = 0; index < e.BytesRecorded; index += 2)
{
short sample = (short)((e.Buffer[index + 1] << 8) | e.Buffer[index + 0]);
float sample32 = sample / 32768f;
Capture(sample32);
}
}
float[] SoundData = new float[1024]; // 音声データ
private void Capture(float sample)
{
SoundData[count] = sample
* (float)FastFourierTransform.HammingWindow(count,1024);
count++;
if (count == 1024)
{
MakeFFT(SoundData);
plotModelFFT.InvalidatePlot(true);
count = 0;
}
DataPointsRT.Add(new DataPoint(counttime, sample));
if (DataPointsRT.Count > 1024) DataPointsRT.RemoveAt(0);
plotModelRT.InvalidatePlot(true);
counttime = counttime + 1.0 / 8000.0;
}
FFT処理
FFT処理のライブラリーは色々とありますが、速度比較、ライセンス等を考えると NAudio が使いやすいように思います。
ここでも、NAudio を使用しています。
public void MakeFFT(float[] data)
{
    var fft = ExecuteFFT(data);
    DataPointsFFT.Clear();
    for (int i = 0; i < 512; i++)
    {
        DataPointsFFT.Add(new DataPoint(i * 4000.0 /512.0, fft[i]));
    }
}

public float[] ExecuteFFT(float[] data)
{
    int len = data.Count();
    int m = (int)Math.Log((double)data.Count(), 2);
    var fftSample = data.Select(v => new Complex { X = v, Y = 0.0f }).ToArray();
    FastFourierTransform.FFT(true, m, fftSample);
    var ret = new float[len / 2];
    for( int i=0 ; i<len/2; i++)
    {
        ret[i] = (float)Math.Sqrt(fftSample[i].X * fftSample[i].X
                + fftSample[i].Y * fftSample[i].Y) * 2.0f;
    }
    return ret;
}
作成したサンプルは次の場所に置いてありますので、詳しくはソースコードを見てもらえればと思います。
github.com
次回は、8. Oxyplot の Heatmap を使ったスペクトグラム表示 について記述したいと思います。