wxpythonでmatplotlibのポイント座標取得
wxPythonで3Dチャートを表示 - メグタンの何でもブログ の続き
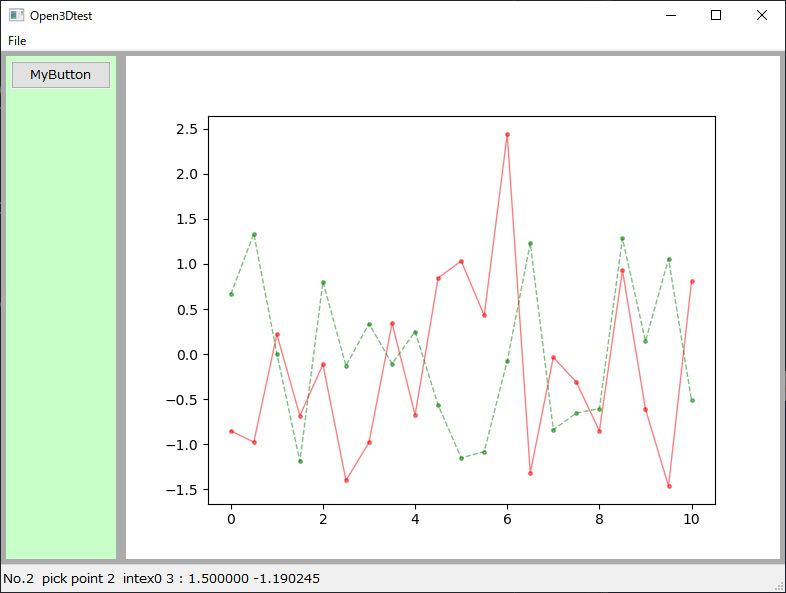
wxpythonのデスクトップアプリ上に表示したmatplotlibグラフの座標読み取り
pick_eventを設定
        self.fig, self.ax = plt.subplots()

        self.fig.canvas.mpl_connect('pick_event', self.on_pick)
        self.line1 = self.SampleData('r', '-', 'No.1')
        self.line2 = self.SampleData('g', '--', 'No.2')
表示するサンプルデータの作成
    def SampleData(self, col, ls, lb):
        x = np.linspace(0,10,21)
        y = np.random.randn(21)
        line, = self.ax.plot(x,y, marker='.', markersize = 5.0,
                                  color =col,alpha=0.5,
                                  label=lb,
                                  linewidth=1.0, linestyle=ls,
                                  picker=True, pickradius=3)
        return line
チャート上のポイントをピックした時のコールバック関数。
    def on_pick(self, event):
        thisline = event.artist
        xdata = thisline.get_xdata()
        ydata = thisline.get_ydata()
        # 選択されたポイントの数
        n = len(event.ind)
        if not n:
            return
        # 最初のindex
        ind = event.ind[0]
        x = xdata[ind]
        y = ydata[ind]
        t = thisline.get_label() + \
        "  pick point {0:d}  intex0 {1:d} : {2:f} {3:f} ".format(n,ind,x,y)
        self.m_statusBar1.SetStatusText(t)